Stock market prediction using Neuroph neural networks
Trying to predict the future value of a company stock or other financial instrument traded on an exchange is called stock market prediction. If we generalize the problem, we end up talking about talking about time series forecasting. This is the construction of a model which can predict future values, based on previously observed values. A common used tool for this kind of prediction are ANNs (artificial neural networks).
In this tutorial, the real life problem which we are trying to solve using artificial neural networks is the prediction of a stock market index value. We will start with an introduction to artificial neural networks, we will continue with a short introduction to Neuroph – a Java neural networks library and afterwards we will implement the prediction algorithm.
Artificial neural networks
The definion of ANNs as found on Wikipedia: “In machine learning and cognitive science, artificial neural networks (ANNs) are a family of statistical learning algorithms inspired by biological neural networks (the central nervous systems of animals, in particular the brain) and are used to estimate or approximate functions that can depend on a large number of inputs and are generally unknown. Artificial neural networks are generally presented as systems of interconnected “neurons” which can compute values from inputs, and are capable of machine learning as well as pattern recognition thanks to their adaptive nature.”
Why neural networks?
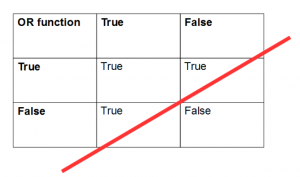
There are of course other machine learning techniques which can approximate functions, but when it comes to a large number of inputs and non linearly separable data, ANNs are the best choice. Let’s see a simple example for linear and non-linear separable data. If we take the OR function the values table looks like this:
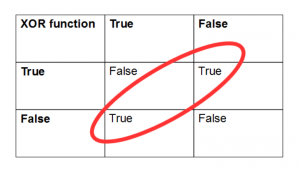
As you can see, we can draw a line in order to separate the “True” values from the “False” values. If we observe the XOR function, we can see that we cannot draw a line to separate the “True” values from the “False” values, we need a special function to do that. The values are not linear separable and we should use ANNs.
The artificial neuron
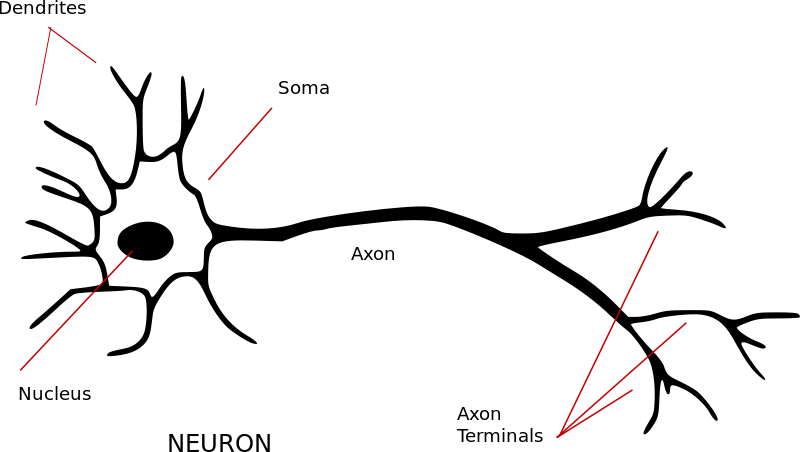
As the name implies, the ANNs is a network of artificial neurons. Let’s see first how a biological neuron looks like:
 We distinguish the following elements:
– the dendrites are the inputs of the neuron. They receive electrical signals from other neurons.
– the soma, or the body of the neuron which contains the nucleus.
– the axon is the output of the neuron, it transmits electrical signals to other neurons.
Similarly we have an artificial neuron which looks like this:
We can see here:
– the inputs X1 to Xn, representing the dendrites. They have weights associated W1 to Wn.
– the transfer function, representing the soma from the biological neuron. Here, the inputs are multiplied by the corresponding weights Xi x Wi and the results are summed – the transfer function in the above diagram.
– the activation function (representing the axon) is a function which gets its input from the transfer function (soma) and decides if the resulted signal is transmitted forward or not. The functions usually have a sigmoid shape, the same function used in logistic regression – see Logistic regression using Apache Mahout tutorial
A network of neurons
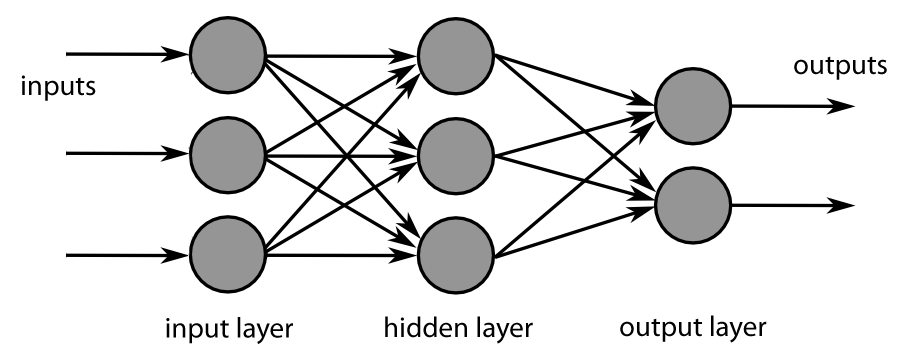
An artificial neural network is a network of fully connected artificial neurons which usually has an input layer, one or more hidden layers and an output layer. The information flows in one direction only: from the input layer to the output layer, passing through the hidden layer. Each unit in a layer is connected in the forward direction to every unit in the next layer. Weights between units encode the network’s knowledge.
The most common ANN type is the backpropagation network. This usually starts with a random set of connection weights. The network is trained (or learns) supervised by iteratively adjusting these weights. The learning process has two steps :
– forward pass: passing input data through the network until it reaches the output layer.
– backpropagation pass: the values from the output layer are compared with the expected values and an error is computed for each output unit. The weights connected to the output units are adjusted to reduce those errors. The error estimates of the output units are then used to derive error estimates for the units in the hidden layers. Here also, the weight are adjusted to reduce the errors. Finally, the errors are propagated back to the connections stemming from the input units.
The error in each layer is multiplied by a term called learning rate, which steers actualy the learning process. A bigger learning rate increases the learning speed but decreases the accuracy and a smaller learning rate takes a longer time, but increases the accuracy of the neural network.
After each round of forward-backward passes, the system “learns” incrementally from the input-output pair and reduces the difference (error) between the network’s predicted output and the actual output. After extensive training, the network will eventually establish the input-output relationships through the adjusted weights on the network.
Neuroph framework
Neuroph is a lightweight Java neural networks framework for developing common neural networks architectures. It provides a Java neural network library as well as a GUI tool that supports creating, training and saving neural networks. Neuroph is released as open source under the Apache 2.0 license. You can find out more about the framework here: Neuroph – Java neural network framework.
Stock market prediction
To predict the future values for a stock market index, we will use the values that the index had in the past. We will train the neural network with the values arranged in form of a sliding window: we take the values from 5 consecutive days and try to predict the value for the 6th day.
For this demo used the values for the S&P 500 Index. Standard & Poor’s 500, is an American stock market index based on the market capitalizations of 500 large companies having common stock listed on the NYSE or NASDAQ. I downloaded the values at 3 years from http://us.spindices.com/indices/equity/sp-500. From the resulting Excel file I kept the first column (with the date) and the last column (the one named S&P 500). The values 2 years back (in my case from 2013 and 2014) are intended for training – rawTrainingData, the values for the current year (2015) are intended for testing – rawTestingData.
The program starts with a data preparation step, where the raw training data is written to a new file with 6 values per row: 5 values with the input data and the 6th value with the expected value. Neuroph expects the input layer to receive values from between 0 (zero) and 1 (one). For this, in this step we will also normalize the input data to have values betwee 0 and 1. This is done by finding the minimum and maximum of the index’s values and for every value to apply the formula:
Normalized value = (Value – Min) / (Max – Min) * 0.8 + 0.1
We use here 0.8 and 0.1 in order to avoid to have 0 and 1 as input values.
The next step is to train the neural network using the normalized data. For the training step we have the option to specify the maximum number of training iterations, the learning rate or the network error after which we can stop training.
We can test the trained neural network by taking 5 consecutive values from the testing data file – rawTestingData and predict the 6th value.
Java project for stock market prediction
Prerequisites:
- Linux or Mac
- Java 1.3
- Apache Maven 3
Create the Maven project:
mvn archetype:generate \
-DarchetypeGroupId=org.apache.maven.archetypes \
-DgroupId=com.technobium \
-DartifactId=neuroph-neural-network \
-DinteractiveMode=false \
Rename the default created App class to NeuralNetworkStockPredictor using the following command:
mv neuroph-neural-network/src/main/java/com/technobium/App.java \
neuroph-neural-network/src/main/java/com/technobium/NeuralNetworkStockPredictor.java
Add the Neuroph repository and library to this project:
cd neuroph-neural-network
nano pom.xml
Add the following repository definition lines above the dependencies section and the Neuroph dependency to the dependencies section:
     ...
     <repositories>
		<repository>
			<id>neuroph.sourceforge.net</id>
			<url>http://neuroph.sourceforge.net/maven2/</url>
		</repository>
	</repositories>
	<dependencies>
        ...
		<dependency>
			<groupId>org.neuroph</groupId>
			<artifactId>neuroph-core</artifactId>
			<version>2.8</version>
		</dependency>
	</dependencies>
Create a folder named input and copy the file containing the training data – rawTrainingData, optionally add also the testing data file –rawTestingData.
Edit the NeuralNetworkStockPredictor class file and add the following code:
package com.technobium;

import java.io.BufferedReader;
import java.io.BufferedWriter;
import java.io.FileReader;
import java.io.FileWriter;
import java.io.IOException;
import java.util.LinkedList;

import org.neuroph.core.NeuralNetwork;
import org.neuroph.core.data.DataSet;
import org.neuroph.core.data.DataSetRow;
import org.neuroph.core.events.LearningEvent;
import org.neuroph.core.events.LearningEventListener;
import org.neuroph.core.learning.SupervisedLearning;
import org.neuroph.nnet.MultiLayerPerceptron;
import org.neuroph.nnet.learning.BackPropagation;

public class NeuralNetworkStockPredictor {

	private int slidingWindowSize;
	private double max = 0;
	private double min = Double.MAX_VALUE;
	private String rawDataFilePath;

	private String learningDataFilePath = "input/learningData.csv";
	private String neuralNetworkModelFilePath = "stockPredictor.nnet";

	public static void main(String[] args) throws IOException {

		NeuralNetworkStockPredictor predictor = new NeuralNetworkStockPredictor(
				5, "input/rawTrainingData.csv");
		predictor.prepareData();

		System.out.println("Training starting");
		predictor.trainNetwork();

		System.out.println("Testing network");
		predictor.testNetwork();
	}

	public NeuralNetworkStockPredictor(int slidingWindowSize,
			String rawDataFilePath) {
		this.rawDataFilePath = rawDataFilePath;
		this.slidingWindowSize = slidingWindowSize;
	}

	void prepareData() throws IOException {
		BufferedReader reader = new BufferedReader(new FileReader(
				rawDataFilePath));
		// Find the minimum and maximum values - needed for normalization
		try {
			String line;
			while ((line = reader.readLine()) != null) {
				String[] tokens = line.split(",");
				double crtValue = Double.valueOf(tokens[1]);
				if (crtValue > max) {
					max = crtValue;
				}
				if (crtValue < min) {
					min = crtValue;
				}
			}
		} finally {
			reader.close();
		}

		reader = new BufferedReader(new FileReader(rawDataFilePath));
		BufferedWriter writer = new BufferedWriter(new FileWriter(
				learningDataFilePath));

		// Keep a queue with slidingWindowSize + 1 values
		LinkedList<Double> valuesQueue = new LinkedList<Double>();
		try {
			String line;
			while ((line = reader.readLine()) != null) {
				double crtValue = Double.valueOf(line.split(",")[1]);
				// Normalize values and add it to the queue
				double normalizedValue = normalizeValue(crtValue);
				valuesQueue.add(normalizedValue);

				if (valuesQueue.size() == slidingWindowSize + 1) {
					String valueLine = valuesQueue.toString().replaceAll(
							"\\[|\\]", "");
					writer.write(valueLine);
					writer.newLine();
					// Remove the first element in queue to make place for a new
					// one
					valuesQueue.removeFirst();
				}
			}
		} finally {
			reader.close();
			writer.close();
		}
	}

	double normalizeValue(double input) {
		return (input - min) / (max - min) * 0.8 + 0.1;
	}

	double deNormalizeValue(double input) {
		return min + (input - 0.1) * (max - min) / 0.8;
	}

	void trainNetwork() throws IOException {
		NeuralNetwork<BackPropagation> neuralNetwork = new MultiLayerPerceptron(
				slidingWindowSize, 2 * slidingWindowSize + 1, 1);

		int maxIterations = 1000;
		double learningRate = 0.5;
		double maxError = 0.00001;
		SupervisedLearning learningRule = neuralNetwork.getLearningRule();
		learningRule.setMaxError(maxError);
		learningRule.setLearningRate(learningRate);
		learningRule.setMaxIterations(maxIterations);
		learningRule.addListener(new LearningEventListener() {
			public void handleLearningEvent(LearningEvent learningEvent) {
				SupervisedLearning rule = (SupervisedLearning) learningEvent
						.getSource();
				System.out.println("Network error for interation "
						+ rule.getCurrentIteration() + ": "
						+ rule.getTotalNetworkError());
			}
		});

		DataSet trainingSet = loadTraininigData(learningDataFilePath);
		neuralNetwork.learn(trainingSet);
		neuralNetwork.save(neuralNetworkModelFilePath);
	}

	DataSet loadTraininigData(String filePath) throws IOException {
		BufferedReader reader = new BufferedReader(new FileReader(filePath));
		DataSet trainingSet = new DataSet(slidingWindowSize, 1);

		try {
			String line;
			while ((line = reader.readLine()) != null) {
				String[] tokens = line.split(",");

				double trainValues[] = new double[slidingWindowSize];
				for (int i = 0; i < slidingWindowSize; i++) {
					trainValues[i] = Double.valueOf(tokens[i]);
				}
				double expectedValue[] = new double[] { Double
						.valueOf(tokens[slidingWindowSize]) };
				trainingSet.addRow(new DataSetRow(trainValues, expectedValue));
			}
		} finally {
			reader.close();
		}
		return trainingSet;
	}

	void testNetwork() {
		NeuralNetwork neuralNetwork = NeuralNetwork
				.createFromFile(neuralNetworkModelFilePath);
		neuralNetwork.setInput(normalizeValue(2056.15),
				normalizeValue(2061.02), normalizeValue(2086.24),
				normalizeValue(2067.89), normalizeValue(2059.69));

		neuralNetwork.calculate();
		double[] networkOutput = neuralNetwork.getOutput();
		System.out.println("Expected value  : 2066.96");
		System.out.println("Predicted value : "
				+ deNormalizeValue(networkOutput[0]));
	}
}
Run the class by using the following command:
mvn compile
mvn exec:java -Dexec.mainClass="com.technobium.NeuralNetworkStockPredictor"
The output should be similar with the one below:
Network error for interation 307: 0.001063806625296876
Network error for interation 308: 0.0010529718187094654
Network error for interation 309: 0.0010423007359251966
Network error for interation 310: 0.0010317909760674932
Network error for interation 311: 0.0010214401709865372
Network error for interation 312: 0.0010112459848999518
Network error for interation 313: 0.0010012061140345805
Network error for interation 314: 9.913182862688965E-4
Network error for interation 314: 9.913182862688965E-4
Testing network
Expected value  : 2066.96
Predicted value : 2065.0891590038827
As you can see, the network error is decreasing with every iteration and the predicted value is very close to the expected value.In the testing method I used the last six value from the rawTestingData file.
The output which you will have will probably be slightly different, as the neural network initializes itself each time with random weight values. Also, if you run the program multiple time, you will get slightly different values each time because from the same reason.
Disclaimer: please take this demo as it is and don’t support you real life stock market buying decisions on it 🙂
GitHub repository for this project: https://github.com/technobium/neuroph-neural-network
Conclusion
Stock market prediction is just one of the usages of artificial neural networks. This interesting machine learning technique which is inspired by the human brain was succesfully used in fields like: medical diagnosis, industrial process control, sales forecasting, credit ranking, employee selection and hiring, employee retention or game development.
References
http://natureofcode.com/book/chapter-10-neural-networks/
http://www.javaworld.com/article/2071879/enterprise-java/a-neural-network-for-java-lego-robots.html
http://neuroph.sourceforge.net/tutorials/StockMarketPredictionTutorial.html


Hello everybody
What is the role of nnet file? and How I can run execute the program without?
Why we use the network model file nnet?
Also seems like some selection bias. If you chose another five consecutive elements from the test data (e.g. 2025.9, 2062.14, 2044.81, 2028.26, 2023.03) with expected value 2011.27, it predicts 2045.60. Of course, you should really be measuring the entire test body against the model. It performs poorly.
seem not to be able to locate stockPredictor.nnet?
Nope. You’ve got a “future leak” in your data.
In your test data you’ve got a reference on 04/02/2015 to the stock price 2066.96.
In your source code you take the 5 previous test data points and feed them into the trained network with the hope of getting something close to 2066.96; which it does.
Yes, of course it does, The neural net has already seen those inputs and the result and adjusted itself accordingly.
Still, it’s a good effort and it does come reasonably close when you try to use out of sample data.
Hi Daniel,
The stock prices from 2015 are part of the testing data which are not used during the training. They are used for testing. The training data contains values older than 2015. In conclusion, the neural network has not seen the input and results before.
Regards,
Leo