Simple linear regression using JFreeChart
Linear regression is one of the simplest supervised learning technique. It is a method for modelling the relationship between one or more input variables X and one output variable Y. The model obtained after the training phase can be in the case of simple linear regression, a mathematical function of the form f(X) = a + b * X = Y. When the output variable depends on more than one input variable, then we have multiple linear regression.
In this tutorial we will see how we can use the simple linear regression to solve a day-to-day problem. We will start by defining the problem, we will then explain how the problem will be solved, then we will get to the practical part and write a Java application. Basic Java programming knowledge is required for this tutorial.
Estimate the price of a house using simple linear regression
The problem we will solve using this machine learning method is the estimation of the price of a house, giving its living area. For this tutorial I gathered the living area and the rent price for 47 houses in Berlin city center. The data is available in a simple text file. Our Java program should tell us the estimated price giving a living area.
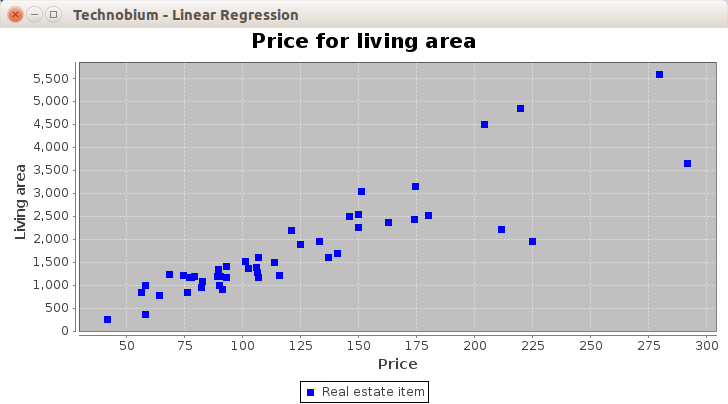
To solve this problem we will use the JFreeChart library. This is a GNU Lesser General Public Licence (LGPL) Java chart library which offers also linear regression tools. We will start by analysing the input data by feeding it to a scatter chart. The chart will show us that the values are distributed in a form of a prolonged, symmetrical shape. This means the data can be fitted to a linear function. Using the JFreeChart library we will find out the a and b parameters of the function f(X) = a + b * X which best fits the input data. Here the a is also called the intercept and b the slope. The key function here is Regression.getOLSRegression. OSL stands for ordinary least squares. This method minimizes the sum of squared vertical distances between the observed responses in the input data and the responses predicted by the linear approximation. The resulted function represents the “model” which our machine learning application will use to estimate new values, not present in the input dataset.
Visualising the input data
Let’s start with a Java application which shows us scatter chart of the input data.
Prerequisites:
- Mac, Linux or Windows
- Java 1.7
- Eclipse with Maven support
Create a new Maven project
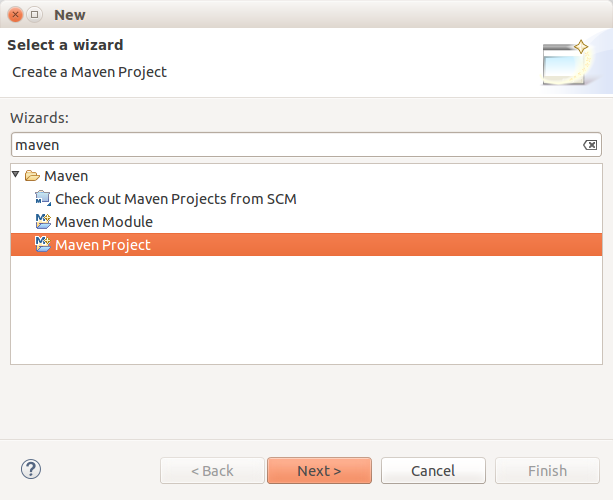
On the next step select “Create simple project (skip archetype creation)”.
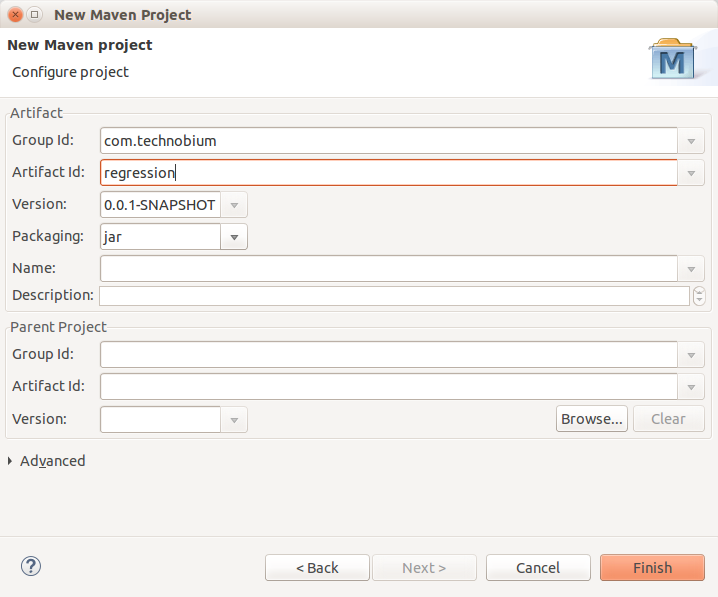
Type in the project details.
Edit pom.xml file and add the following dependecy in the dependecies section.
<dependencies>
    <dependency>
        <groupId>org.jfree</groupId>
        <artifactId>jfreechart</artifactId>
        <version>1.0.15</version>
    </dependency>
</dependencies>
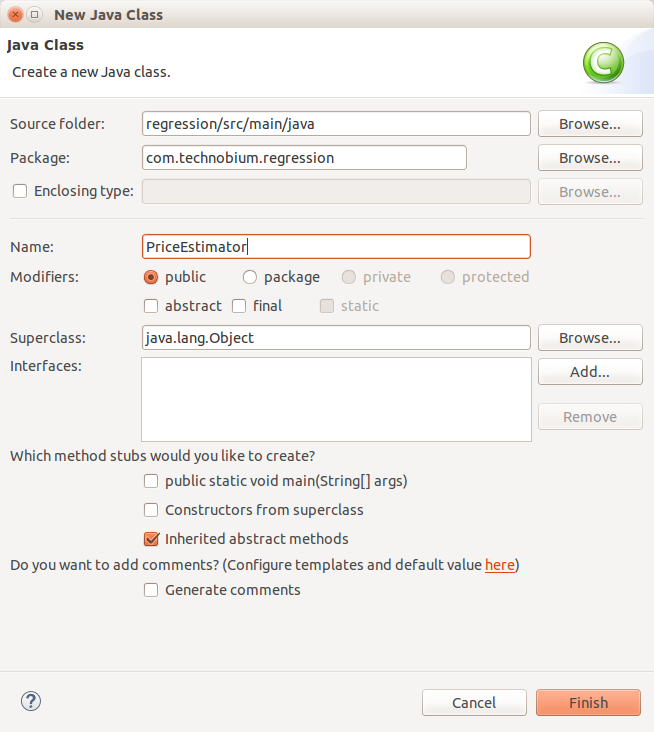
Add to this project a Java class named PriceEstimator.
Paste the following code in the new class file:
package com.technobium.regression;

import java.awt.Color;
import java.io.File;
import java.io.IOException;
import java.util.Scanner;

import org.jfree.chart.ChartFactory;
import org.jfree.chart.ChartPanel;
import org.jfree.chart.JFreeChart;
import org.jfree.chart.plot.PlotOrientation;
import org.jfree.chart.plot.XYPlot;
import org.jfree.chart.renderer.xy.XYItemRenderer;
import org.jfree.chart.renderer.xy.XYLineAndShapeRenderer;
import org.jfree.data.function.LineFunction2D;
import org.jfree.data.general.DatasetUtilities;
import org.jfree.data.statistics.Regression;
import org.jfree.data.xy.XYDataset;
import org.jfree.data.xy.XYSeries;
import org.jfree.data.xy.XYSeriesCollection;
import org.jfree.ui.ApplicationFrame;
import org.jfree.ui.RefineryUtilities;

public class PriceEstimator extends ApplicationFrame {

	private static final long serialVersionUID = 1L;

	XYDataset inputData;
	JFreeChart chart;

	public static void main(String[] args) throws IOException {
		PriceEstimator demo = new PriceEstimator("prices.txt");
		demo.pack();
		RefineryUtilities.centerFrameOnScreen(demo);
		demo.setVisible(true);
	}

	public PriceEstimator(String inputFileName) throws IOException {
		super("Technobium - Linear Regression");

		// Read sample data from prices.txt file
		inputData = createDatasetFromFile(inputFileName);

		// Create the chart using the sample data
		chart = createChart(inputData);

		ChartPanel chartPanel = new ChartPanel(chart);
		chartPanel.setPreferredSize(new java.awt.Dimension(500, 270));
		setContentPane(chartPanel);
	}

	public XYDataset createDatasetFromFile(String fileName) throws IOException {
		ClassLoader classLoader = getClass().getClassLoader();
		File file = new File(classLoader.getResource(fileName).getFile());
		Scanner scanner = new Scanner(file);

		XYSeriesCollection dataset = new XYSeriesCollection();
		XYSeries series = new XYSeries("Real estate item");

		// Read the price and the living area
		while (scanner.hasNextLine()) {
			if (scanner.hasNextFloat()) {
				float livingArea = scanner.nextFloat();
				float price = scanner.nextFloat();
				series.add(livingArea, price);
			}
		}
		scanner.close();
		dataset.addSeries(series);

		return dataset;
	}

	private JFreeChart createChart(XYDataset inputData) throws IOException {
		// Create the chart using the data read from the prices.txt file
		JFreeChart chart = ChartFactory.createScatterPlot(
				"Price for living area", "Price", "Living area", inputData,
				PlotOrientation.VERTICAL, true, true, false);

		XYPlot plot = chart.getXYPlot();
		plot.getRenderer().setSeriesPaint(0, Color.blue);
		return chart;
	}
}
In the src/main/resources create a text file named prices.txt which should contain the sample data available here.
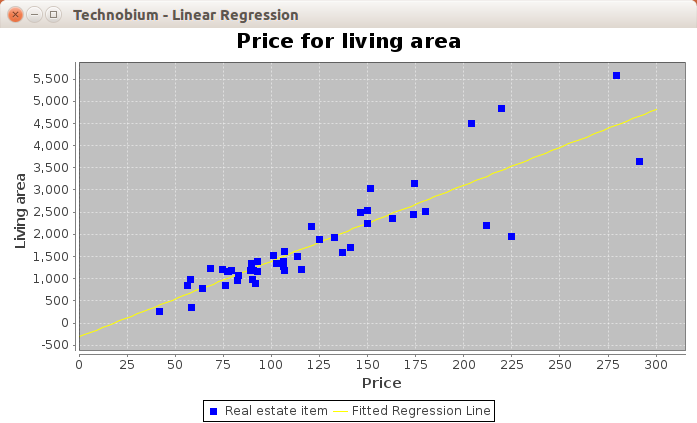
You can now run the code. You should now see the blue points representing the living area on the x axis and the price on the y axis.
Add regression line to the graph
We can obtain the line which best matches the given points. To do that, add the following method at the end of the class.
	private void drawRegressionLine() {
		// Get the parameters 'a' and 'b' for an equation y = a + b * x,
		// fitted to the inputData using ordinary least squares regression.
		// a - regressionParameters[0], b - regressionParameters[1]
		double regressionParameters[] = Regression.getOLSRegression(inputData,
				0);

		// Prepare a line function using the found parameters
		LineFunction2D linefunction2d = new LineFunction2D(
				regressionParameters[0], regressionParameters[1]);

		// Creates a dataset by taking sample values from the line function
		XYDataset dataset = DatasetUtilities.sampleFunction2D(linefunction2d,
				0D, 300, 100, "Fitted Regression Line");

		// Draw the line dataset
		XYPlot xyplot = chart.getXYPlot();
		xyplot.setDataset(1, dataset);
		XYLineAndShapeRenderer xylineandshaperenderer = new XYLineAndShapeRenderer(
				true, false);
		xylineandshaperenderer.setSeriesPaint(0, Color.YELLOW);
		xyplot.setRenderer(1, xylineandshaperenderer);
	}
At the end of the main function add the call to the new function.
	// Draw the regression line on the chart
		demo.drawRegressionLine();
You should now see a yellow regression line like the one in the following image.
Estimate the price
Add the following code to the end of main function:
		// If we have an input parameter, predict the price and draw the new point
		if (args.length >= 1 && args[0] != null) {
			// Estimate the linear function given the input data
			double regressionParameters[] = Regression.getOLSRegression(
					demo.inputData, 0);
			double x = Double.parseDouble(args[0]);

			// Prepare a line function using the found parameters
			LineFunction2D linefunction2d = new LineFunction2D(
					regressionParameters[0], regressionParameters[1]);
			// This is the estimated price
			double y = linefunction2d.getValue(x);

			demo.drawInputPoint(x, y);
		}
Add the following method at the end of the class:
	private void drawInputPoint(double x, double y) {
		// Create a new dataset with only one row
		XYSeriesCollection dataset = new XYSeriesCollection();
		String title = "Input area: " + x + ", Price: " + y;
		XYSeries series = new XYSeries(title);
		series.add(x, y);
		dataset.addSeries(series);

		XYPlot plot = (XYPlot) chart.getPlot();
		plot.setDataset(2, dataset);
		XYItemRenderer renderer = new XYLineAndShapeRenderer(false, true);
		plot.setRenderer(2, renderer);
	}
Now you should create a new Run Configuration, from Eclipse menu Run > Run Configurations. In the Arguments tab, for PriceEstimator Java Application add a number representing the desired living area, 200 for instance. If you run the app from here, you should see a graph like the following one:
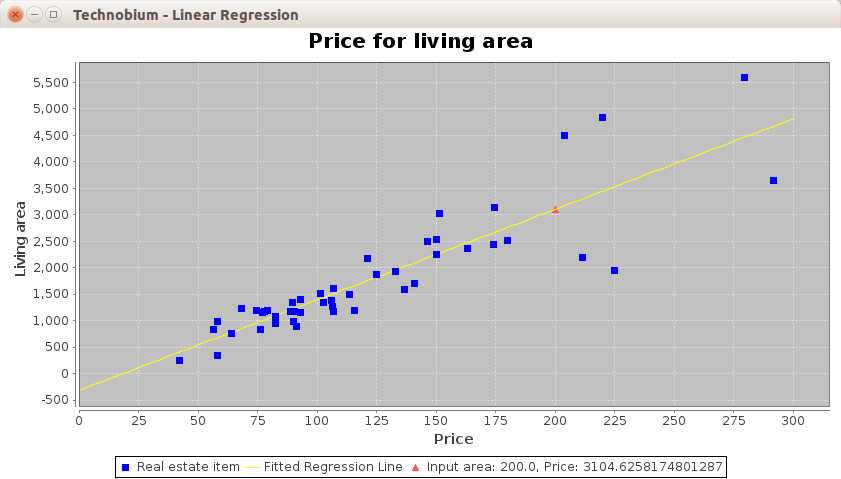
The red triangle represents the point with the living area 200. In the legend section you can see the rent price estimation for this area: 3104.
GitHub repository for this project: https://github.com/technobium/jfreechart-regression
Conclusion
We saw how we can use simple linear regression to estimate the rent price for a living area given a set of existing data. This is a basic usage of this machine learning technique. Which other use cases can you see for simple linear regression?
References
http://www.jfree.org/jfreechart/


Thank you! I found it quite interesting. Regards
Hi Massimo,
Thank you for your kind words.
Leo
Hi Brother,
could you please send this code to me ??
Hi Hussain,
All the code you need is contained in the article. I haven’t used any separate class.
Leo